|
|
A free tool for iOS Forensics Verification, Validation, Reporting and Research from DoubleBlak |
| |
Press BEGIN at the top left.
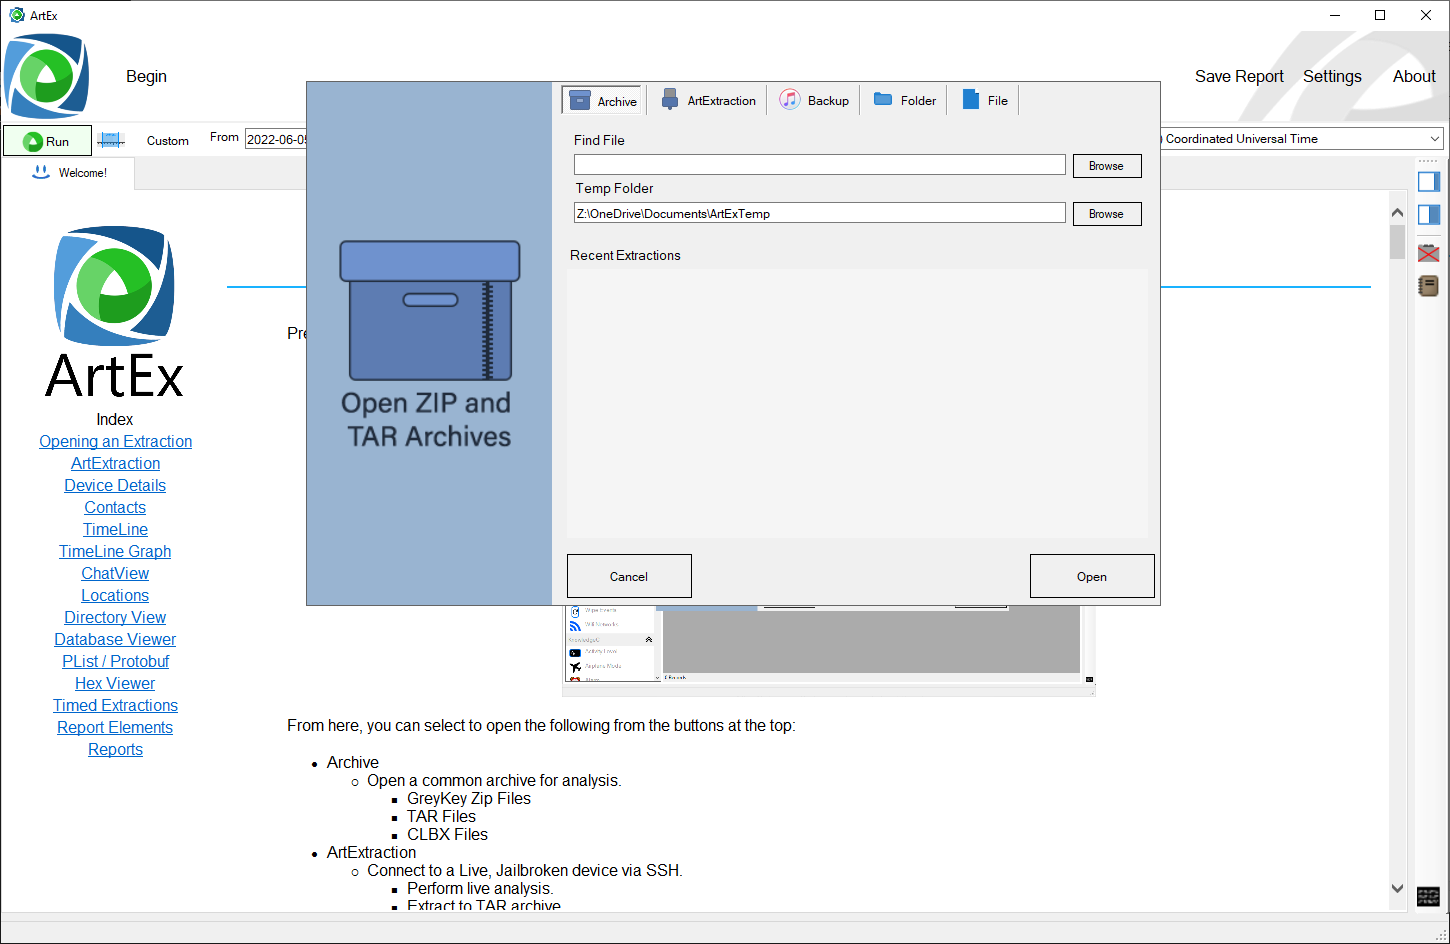
From here, you can select to open the following from the buttons at the top:
- Archive
- Open a common archive for analysis.
- GreyKey Zip Files
- TAR Files
- CLBX Files
- ArtExtraction
- Connect to a Live, Jailbroken device via SSH.
- Perform live analysis.
- Extract to TAR archive.
- iTunes Backup
- Open an UNENCRYPTED iTunes backup
- Folder
- Map a Full or Partial Folder structure and perform analysis as if it was an archive.
- ArtEx will try to parse any files it recognizes. For example, if your folder contains a KnowledgeC database and sms.db, both would parse as if they were on a full extraction.
- File
- Open a single file. ArtEx will try to parse it as if it was part of an archive.
- As with Folders, ArtEx will try to treat the file as part of an archive and will parse it if it is supported.
In the case of Archive, Folder or File, simply find the appropriate file/folder, select a Temporary Folder where ArtEx can store files and press “Open”.
ArtExtraction takes a little more effort which is covered in the next section.
In all cases, ArtEx will scan the connection and check which parsers are eligible to run, removing from the list any parses that it knows won’t work.
During this initial process, ArtEx will also try to parse Device Details, Contacts and Locations (if selected in settings).
Now we have some parsed data, we can start looking at the tools interface properly.
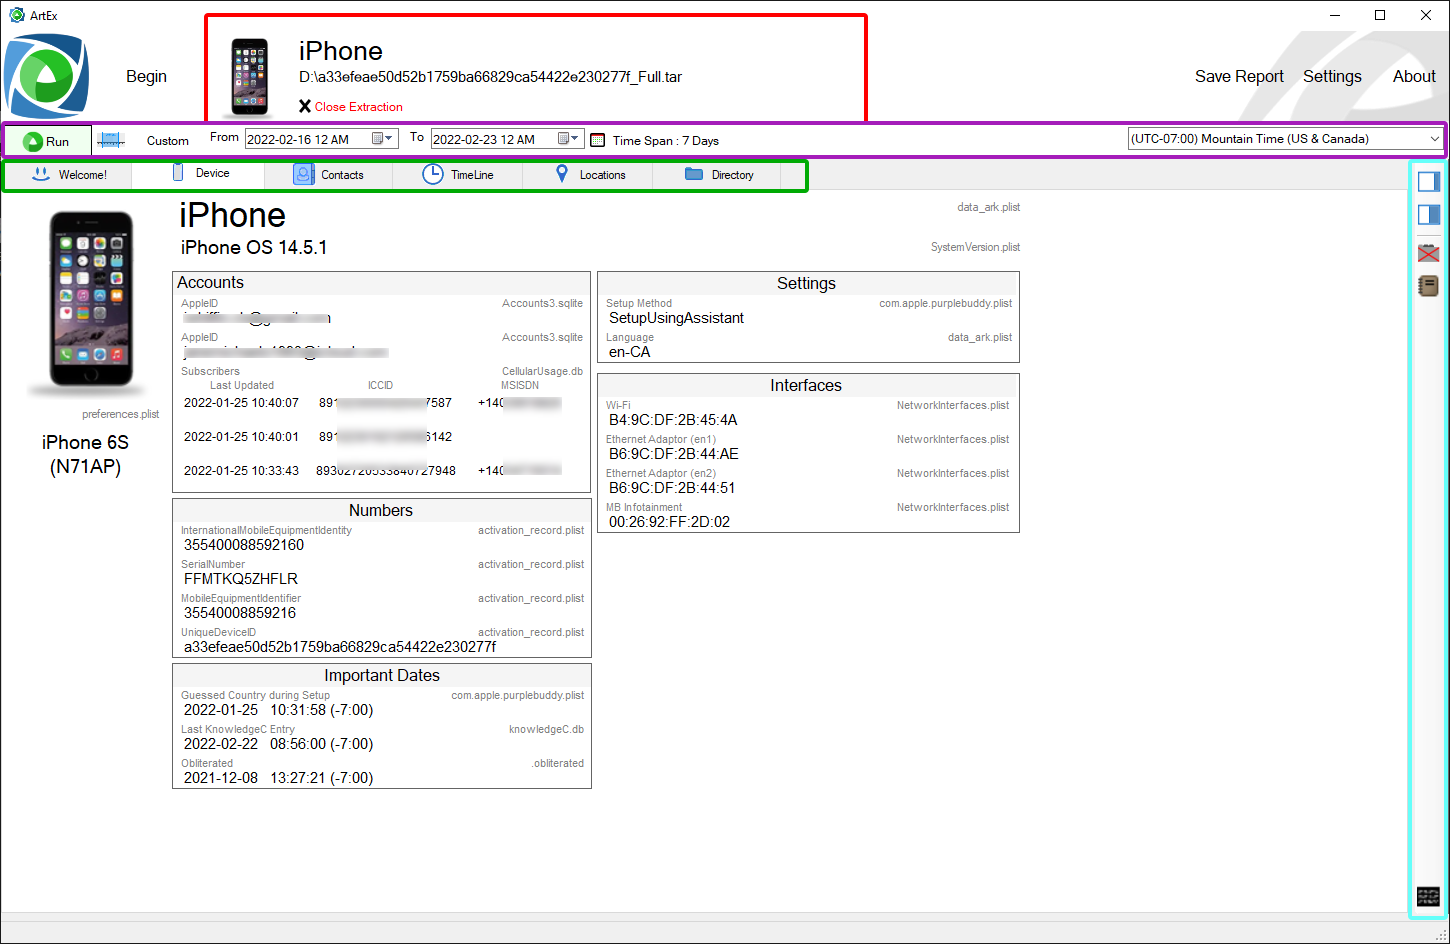
The top RED area shows the extraction information including device name and extraction location.
The PURPLE area shows date information and has the main RUN button.
- RUN Button to process any changes made
- "Times Of Interest" Allows you to add a time frame to the graph to highlight the time of an event. More on this later.
- “Quick Date” allows you to quickly select common Dates to view including “This Week” and “This Month”.
- Start Date
- End Date
- Save Date Range – ArtEx will automatically load the selected Start and End dates the next time you load this extraction.
- Date Range
- Time Zone
The GREEN area is the available tabs. These typically include:
- Welcome – This guide
- Device – Device information
- Contacts – Contacts parsed from the main Address Book application. Note that if you later choose to parse a communications app, the contacts for that app will also show here.
- TimeLine – The main ArtEx interface.
- Chat View – Chat View of the messages that are present in the TimeLine.
- Locations – Locations from the device presented on one large map.
- Directory – Directory View of the device to allow you to navigate around the files/folders.
Note that these tabs will only appear when appropriate. For example, Device Details will not be available unless there is some details to show.
The CYAN area is the Side Panel. Additional information will be presented here such as media or databases etc. The buttons in the toolstrip are:
- View Side Panel as 1/3 of the screen.
- View Side Panel as 1/2 of the screen.
- Remove all Side Panel content.
- Report Elements – All saved images for your report.
- Console (At the bottom) to view processes/errors.
|
| |
ArtExtraction has two features:
1) Provide a means to perform data extraction from a JailBroken device to a TAR file.
2) Provide Live Connection to a JailBroken device.
Note :
ArtEx provides no jailbreaking capability and cannot be used for cracking passcodes. It is assumed that the device you will be connecting to is your own test device which is already jailbroken.
|
The benefits or ArtExtraction really lie in the ability to connection to a device and see the affects your actions have on the device in almost real time.
- The device must be jailbroken.
- From cydia, install “OpenSSH”.
- I recommend installing 3u Tools and using the SSH Tunnel for speed.
- You can connect over WiFi to the IP address but it will be slower.
- The default SSH Tunnel IP Address and Port are already input, as well as the default iOS Username and Passwords.
- Select a Temp Folder and press Open.
Note that because file mapping occurs on first connection to the device, any files created afterwards will not be found. ie:
- Connect to device
- Take a photograph
- Refresh the Photos.
- The record of the photograph will appear but the image itself will not. This is because the photos.sqlite database existed when the device first connected & mapped but the new image file did not.
To get around this, you will see a "Remap" button appear underneat the "Begin" button. This will remap the device and will include any new files that have been created.
|
| |
This view is self explanatory. All device data will be shown here.
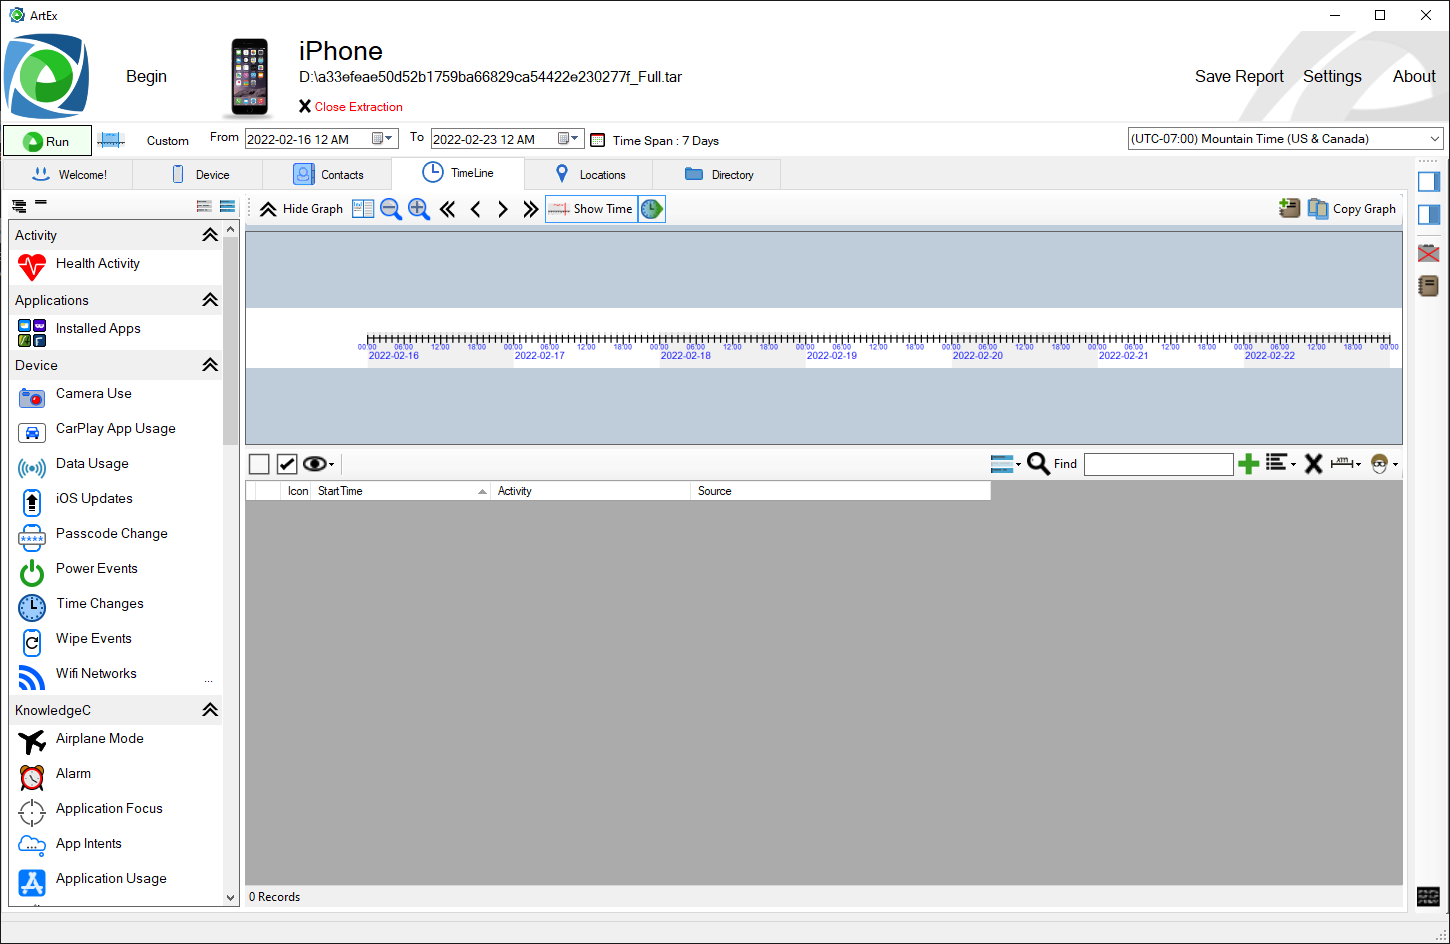
| TIP : Pressing the source file name will load the file in the Side Panel. Clicking a value such as the IMEI, will copy the copy the value to your clipboard. |
|
| |
Find all contacts on here for items that have been parsed.
Upon initial loading, only the standard Contacts list will be parsed and shown.
Finding contacts for 3rd party applications requires parsing the 3rd party application in the timeline. For example, if you wanted Snapchat contacts, run the SnapChat parser. |
| |
The timeline view allows you to select just the artifact types you are interested in and adheres to the Start/End date selected in the Time Bar.
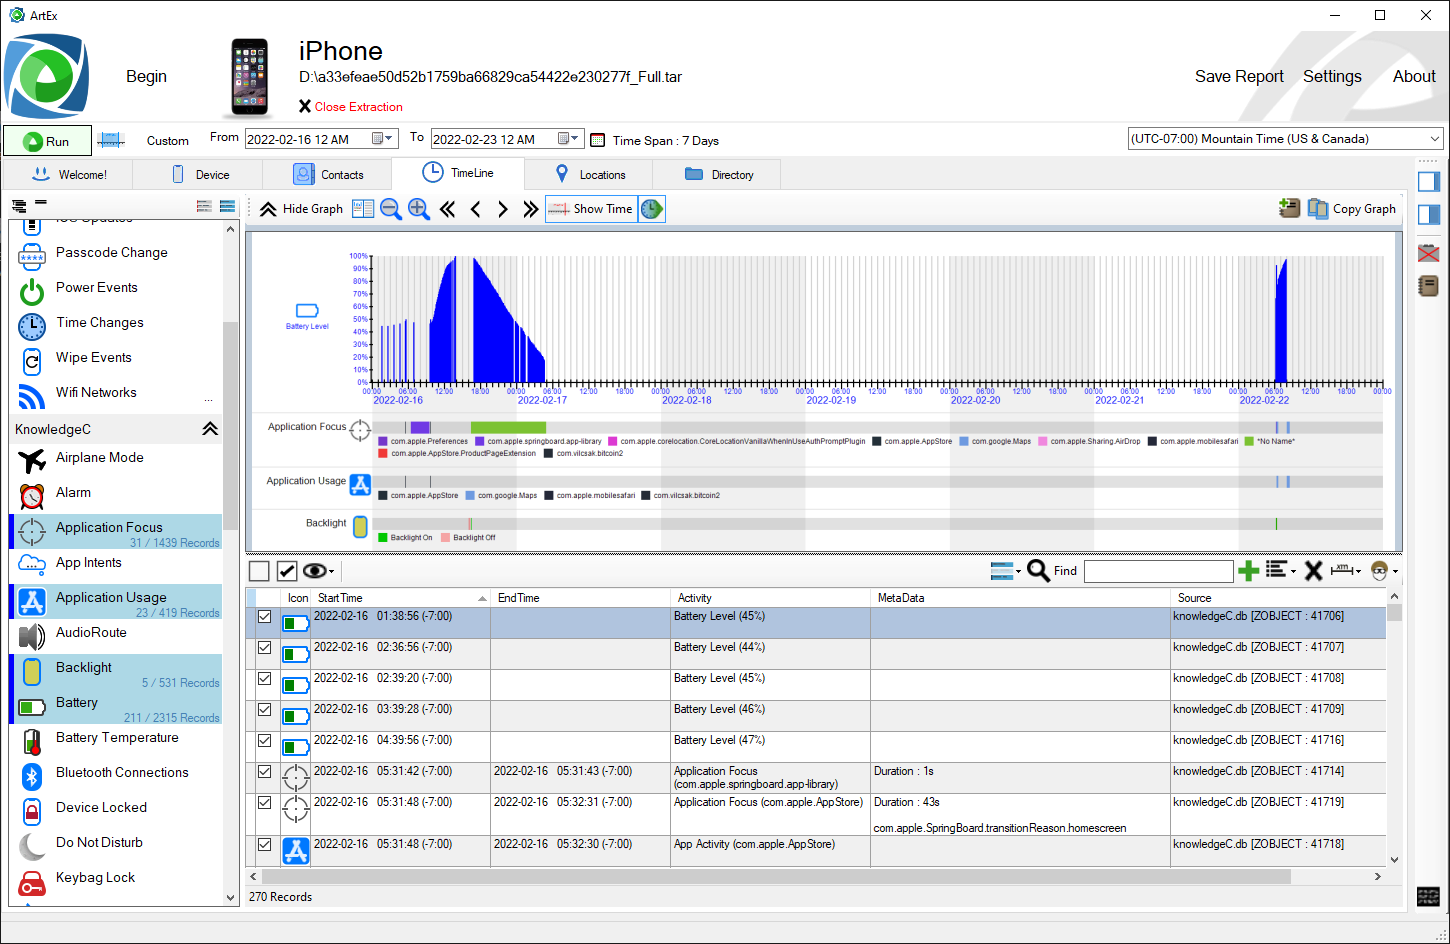
Artifact Types
- All installed Parsers are listed in the left panel. Simply select/deselect what you want to view.
- Clicking a header such as LOCATIONS will select all children. Double clicking the header will deselect all children.
- At the top of the pane are 4 buttons; Expand All headers, Collapse all Headers, Select all Parsers and deselect all Parsers.
- Some Parsers have ellipsis (…) at the right side. This is for additional options such as whether you want ArtEx to render a map for the parser type or not.
Graph
If you selected time range is under 32 days, ArtEx will graph out the data. This can be useful for seeing how artifacts can interplay with each other. For example, seeing how a Notification arrives and the Backlight lights up when a message is received.
The buttons at the top toolstrip are:
- Show/Hide the graph
- Switch between Horizontal and Vertical layout.
- Zoom in/Out of the graph image
- Jump Back 24 Hours / Jump back 1 hour / Jump forward 1 hour / Jump forward 24 Hours.
- Show selected Time – Show the time highlighted by the mouse over the graph.
- AutoRun On/Off – Selects whether ArtEx should automatically run when any graph action is taken.
At the far right of the toolstrip:
- Add Report Element – Save this graph image to the Report Elements
- Copy Graph – Copy graph to clipboard.
You can interact with the graph in several ways:
- Mouse Scroll Wheel to move forward/backwards in time.
- Ctrl + Mouse Wheel to widen/shorten the timer period being viewed.
- Click and Drag to select a new time period to view.
- Click once to jump to the appropriate time in the table view.
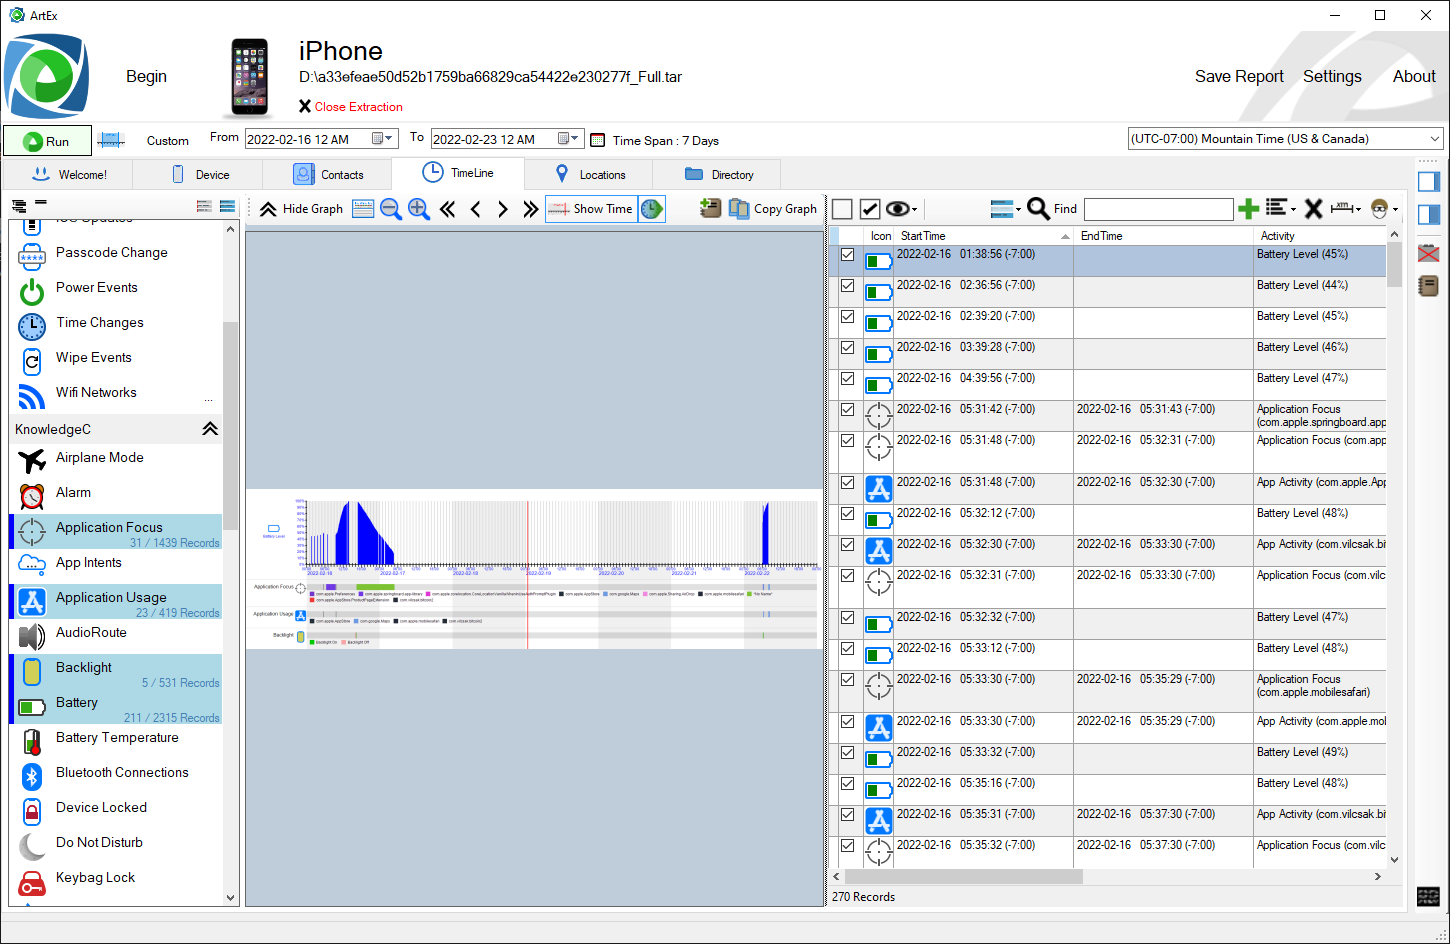
The lower section of the screen is the Table View. The options in the toolstrip are:
- Deselect All / Select All
- View Options - View only Selected / Deselected and change font size.
At the far right of the toolstrip:
- Parser Filter - Temporarily filter the table view by specific parsers
- Find tool - Find specific records in the table
- Filter Text Box - Type a term to the Filter List
- Add to Filter - Add the typed term to the Filter List
- Filter List - This will show all typed terms being used to filter the table. You can select if the terms are AND or OR and remove individual terms from the list.
- Clear Filter Terms - Remove all Filter Terms
- Accuracy Filter – Filter results by accuracy
- Photograph Filter – Filter results by person descriptions such as Male/Female/Glasses/Beard (This uses Apple's own photo classification engine).
The table view contains the following columns (Note that not all may be visible as it depends on the data being parsed).
- Select/Deselect
- Icon
- Start Date/Time
- End Date/Time*
- Activity – Brief overview of the artifact
- MetaData – Details of the artifact
- Message – The contents of any message
- Image Preview – A photo/screenshot/MMS etc.
- Map – A rendered map based on the GPS coordinates in the artifact.
- Source – Where the artifact was found.
Tip : Double click on the Media or Map item to load it into the Side Panel. Double click the Source field to load the source file into the Side Panel.
|
Note : At this time, not all formats image formats are supported. As such, ArtEx may show substitute images. For example, since HEIC photos are not supported, the appropriate thumbnail image will be substituted instead.
|
Note :
Maps currently requires an active internet connection. It may take a long time to render if there are a lot of records. In order to make things a little better, ArtEx will only create maps for locations with an accuracy value under 200m (unless you specify otherwise).
|
Times Of Interest
Use "Times of Interest" to make it easier to focus on specific time periods.
Enter multiple times and select a colour for each. Not only will the periods show up on the graph, but they will show in the table view too. Allowing you to quickly see what occured during the time period being investigated.
<<Timeline>>
<<Table>>
|
|
| |
ChatView will show the parsed conversations in threaded form.
Only the chats that are shown in the timeline view will be shown in the ChatView.
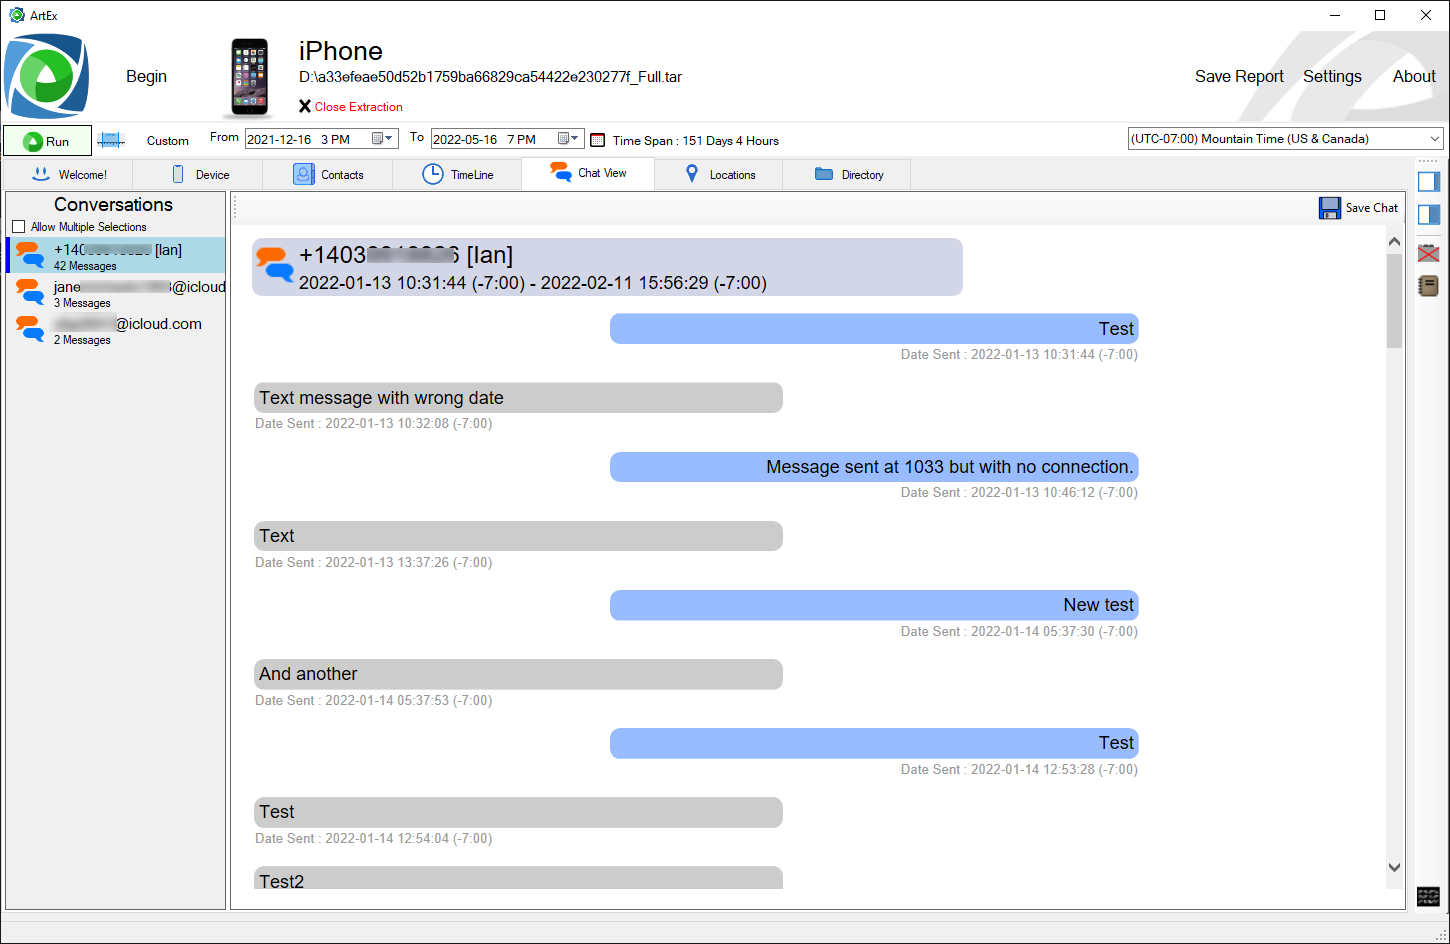
Select the conversation you would like to see on the left menu.
By default, only one conversation can be viewed at a time but selecting "Allow Multiple Selections" will allow multiple conversations to be shown on a single page.
A "Save Chat" button at the top right allows for exporting the currently displayed chat(s). |
| |
Locations plots all locations found on the device onto a single map, while still adhering to the selected time period.
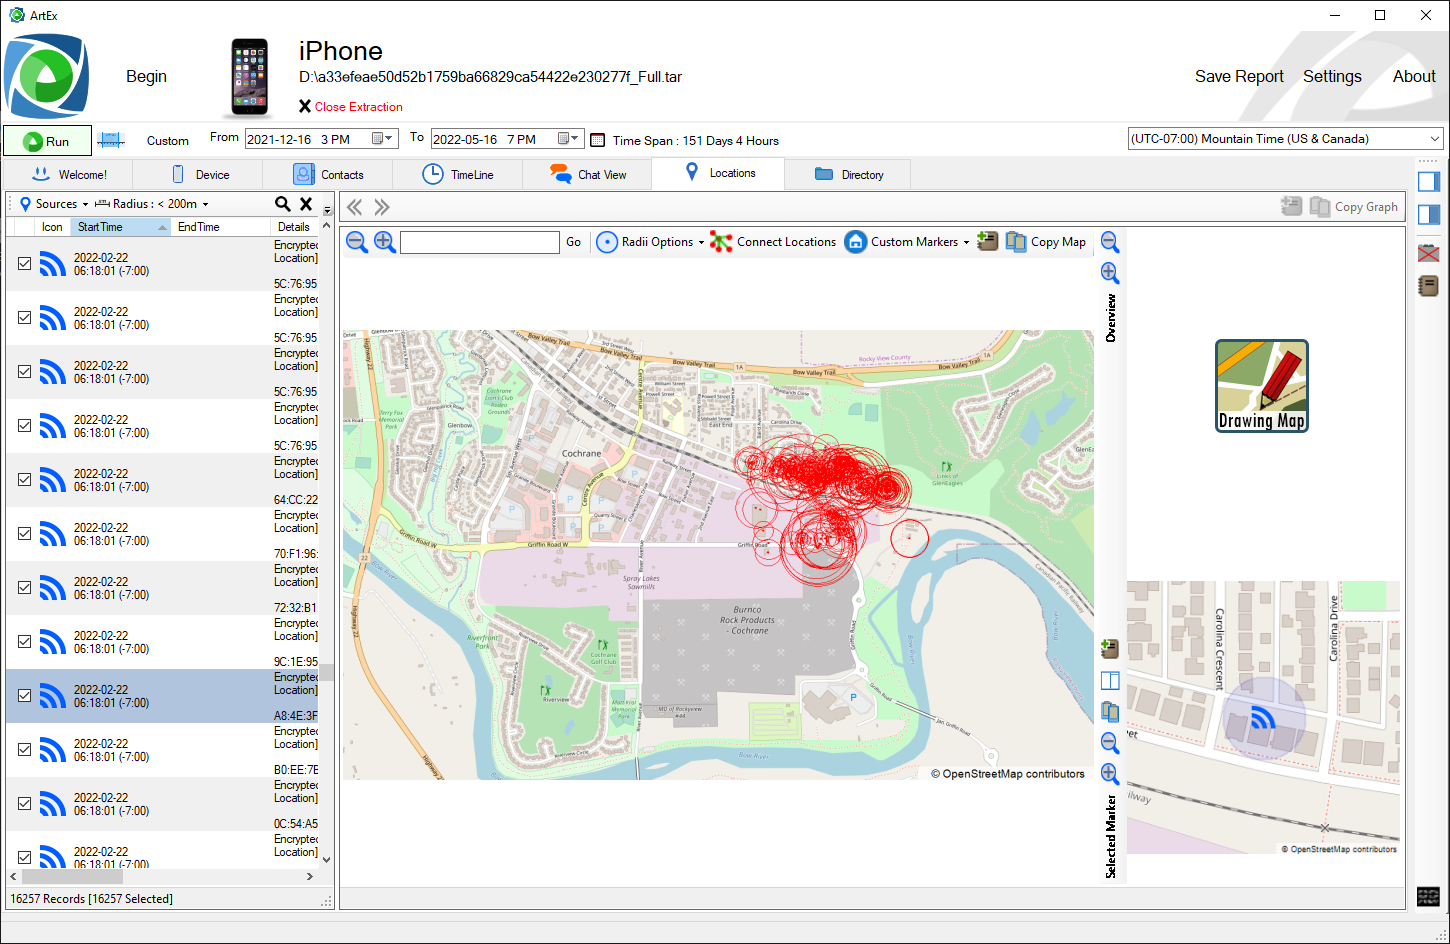
The table view is found on the left. Columns include Timestamps, data such as BSSID, GPS Coordinates and Source.
The Options at the top of the table view include:
- Source – Filter the results by their source. Turn on/off EncryptedB, Cache, ThreeBars etc.
- Radius – Filter the results by the accuracy.
- Filter / Clear Filter
- Select / Deselect All
- Create Flipbook (More information later)
Any filters applied to the table view will be reflected in the Locations Graph and Map.
Locations Graph…
The Largest graph shown above is the main graph that shows all locations.
Each type of marker is shown in a different colour. The accuracy radius (if one exists) will be shown and can be controlled from the menu above.
Clicking on the map will recenter it. So if you want to move the map to the right, click to the right side.
Zoom in / Out using the menu above or using the Mouse Wheel.
Right Click to load a context menu where you can:
- Copy the GPS Coordinates to the Clipboard
- Apply a distance filter from the selected location.
- Load the location in Google Maps.
Options on the menu include:
- Zoom in/Out
- Jump to GPS Coordinate
- Radii Options – Choose to turn the Accuracy Radius off altogether or just change the opacity.
- Connect Locations - Experimental/Research feature. Used to draw a correlation between harvested locations (such as those found in EncryptedB) and actual device locations at the time.
- Custom Markers – Add your own markers to the map such as HOME, CAR, DUMP SITE, FIRE etc.
- Copy Map to clipboard.
- Save Map to Report Elements.
The map on the top right is an overview. No markers are shown here. The options on the vertical toolstrip are simply Zoom In / Out.
The map on the bottom right is a zoomed in view of the selected record(s) in the table view. The first selected record will be centered on the map, all other selected records will be displayed but will have no affect on the bounds of the map.
Options on the toolstrip are:
- Save to Report Elements
- Change Layout to prioritize this map over the overview
- Copy map to clipboard
- Zoom In / Out
Note :
By default, ArtEx will draw all locations with a semi-transparent circle to denote radius. If many circles are stacked, the map may appear orange.
Simply use the "Radii Options" to reduce the opacity or turn off altogether.
|
FlipBooks
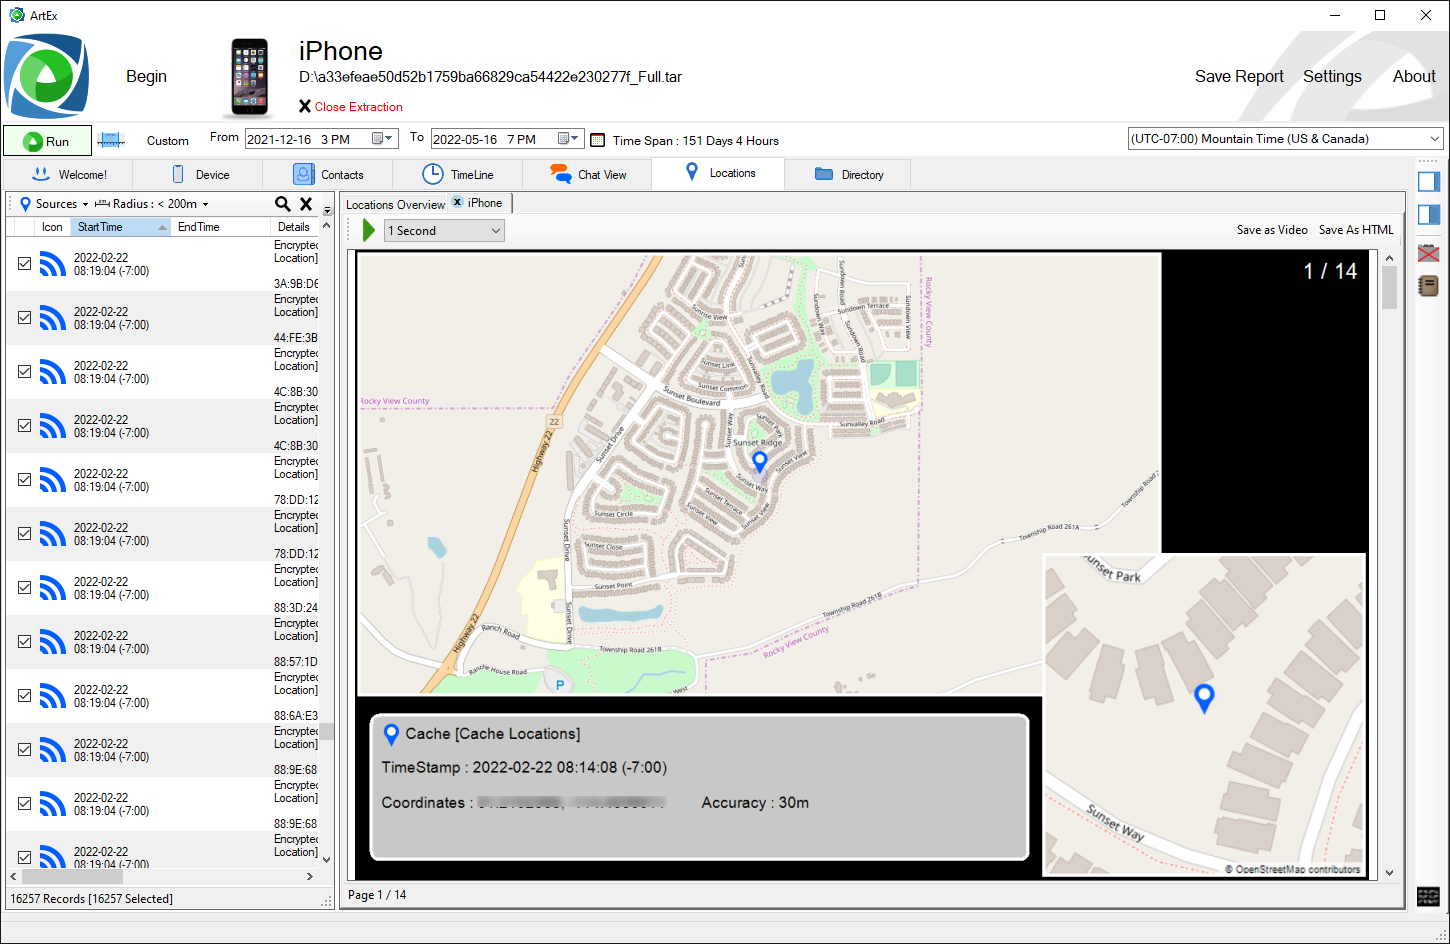
FlipBooks allow you to make slideshows out of selected locations. Highlight the rows you want to include in the slideshow and press the 'Create Flipbook' button
Give the FlipBook a name and press
'Build Flipbook'.
A new tab will be presented that shows the selected locations as a slideshow and allows scrolling to move though the selections.
At the top right, you can export the Flipbook as either a HTML report or video. Note that exporting as a video requires FFMPEG installing at C:\FFMPEG
Note :
Note that it is the rows you have highlighted that will be made into a FlipBook, not the records showing or checked.
Use Shift or Ctrl + Left Click to highlight multple records or Ctrl+A to highlight them all.
|
|
| |
For users who cannot operate ArtEx while online, there is a Tile Grabber option to download required Map Tiles from the Internet.
Use ArtEx as usual, and when tiles are required, you will be prompted to download the required tiles.
Follow the instructions which will guide you through the following process:
1) Insert a USB and select the drive letter.
2) The list of required tiles will be copied to the USB along with an executable.
3) Run the executable on an Internet Connected computer.
4) The required tiles will be downloaded to the USB
5) Return to the main computer and finish the process which copies the tiles to the MapTiles database.
ArtEx will download more tiles than are strictly necessary in an attempt to limit the number of tiles being downloaded. This process may be requested several times however and there is currently no option to download entire areas.
ArtEx will save the tiles for use in the future.
|
| |
The Directory view is a simple way to navigate around the extraction. As you would expect, the Folders are shown in the left pane and the contents of the selected folder are shown in the main window.
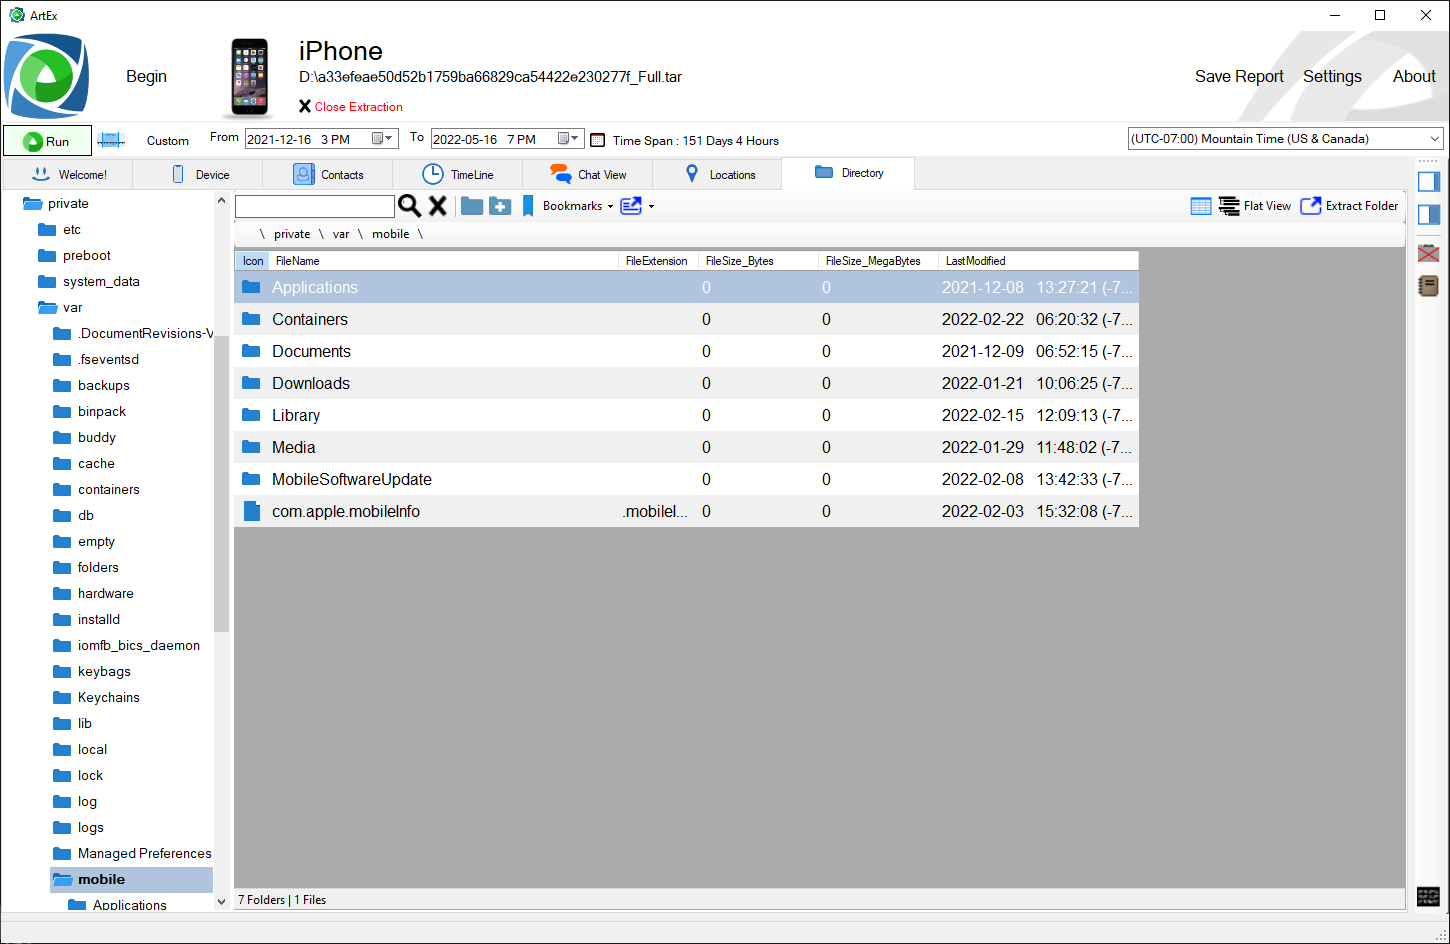
The available options on the toolstrip are:
- Search – Type your search string and press the magnifying glass. Note that this action disables the folder pane on the left.
- Cancel Search – This removes your query and re-enables the folder pane.
- Bookmarks – Allows you to save common locations that you navigate to for quicker access. This menu also includes a Bookmark Manager.
- Export Options – Allows you to export the current folder or selected file(s). Also allows access to ‘Timed Extraction’ which is covered later.
- Turn on / off folders from main view – Removes folders from the main view, leaving only files.
- Flat View - Show all files from the current folder down and ignore the folder structure.
- Dump Folder – Quickly dump the current folder.
A secondary toolstrip bar shows the breadcrumb trail for the current folder and allows you to jump to any part of it.
You can also Right Click on the files/folders for contextual options including:
- Copy the path
- Jump to folder
- View file in Hex
- Add location to Bookmarks
- Add to timed extraction
Double clicking a file will try to open it in the Side Panel.
Files such as Images, Databases, Plists etc are supported. |
| |
Beta 2.2 receieved an overhaul of the SQL Viewer and how ArtEx handles SQLite data in general.
A custom SQLite parser has been written to recover deleted records from the Freepages. This can be toggled on/off in settings to affect the Timeline graph.
If it is turned on, then the advanced parser will automatically run when a SQLite database is opened. If it is turned off, you can elect to run it using the "+" icon in the top right.
There are now 3 tabs at the top of the SQL tab : SQLViewer, SQL Explorer and WAL Explorer (if applicable).
The main database window:
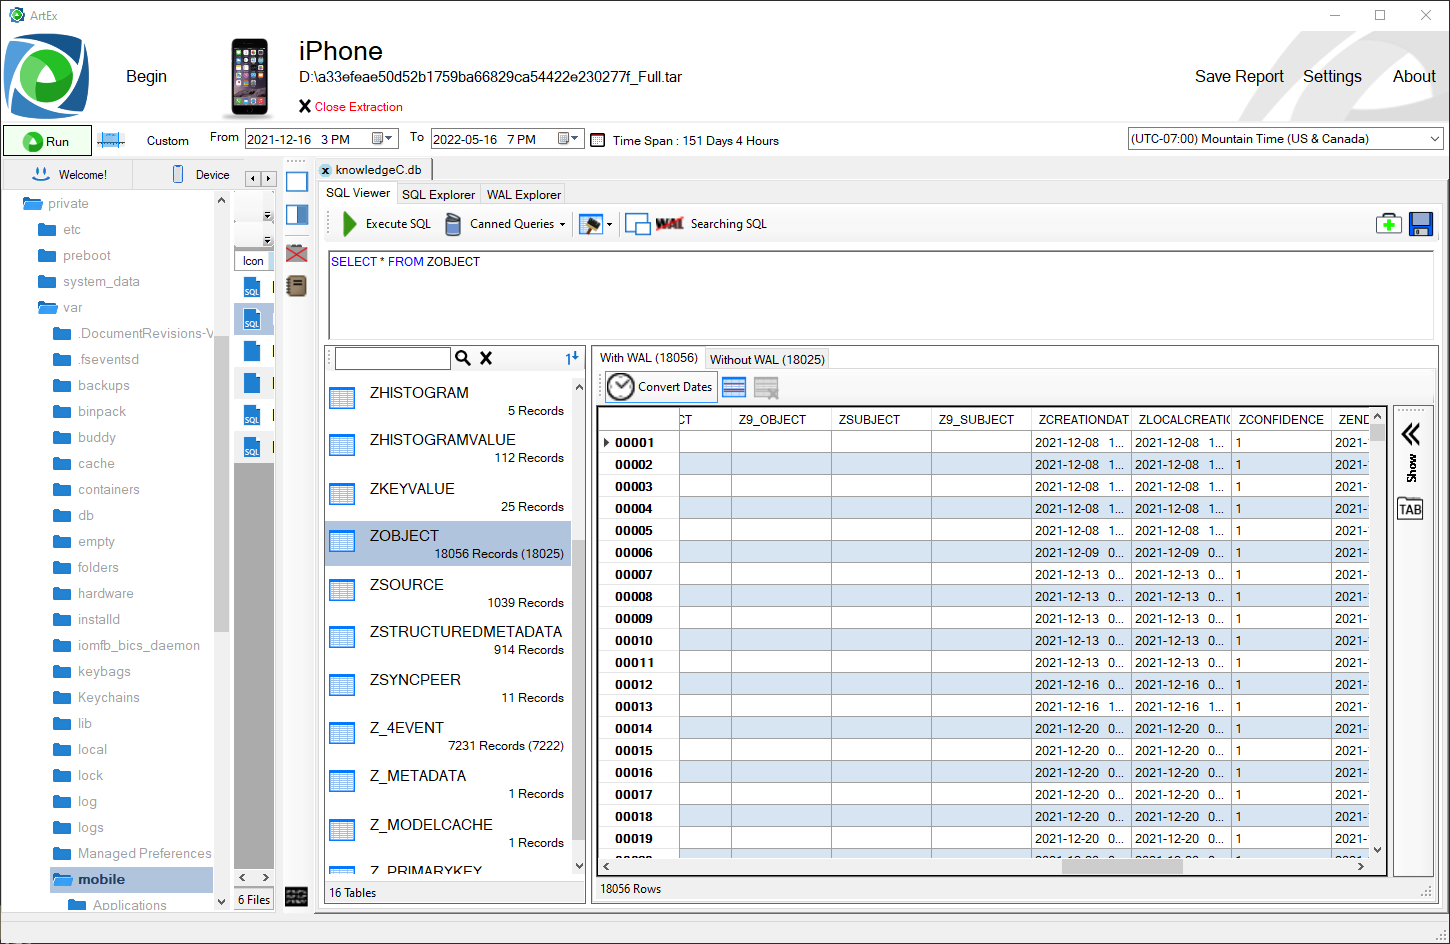
The window can be separated into 3 sections.
The Query window is at the top and shows the current query being ran and allows you to write your own query.
The toolstrip includes the options:
- Run Query
- Canned Queries – Save and reuse queries relevant to the database being viewed. This option includes a Canned Queries Manager.
- Layout – See the layout of the current table or every table in the database.
- Undock – Pop the database out of the tab view and into it’s own window.
- WAL Comparison - If available, this will compare the database with or without applying the WAL.
- Search Type - Beta Feature. More information on this lower down.
- Advanced SQL - Processes the main database and WAL file (if not selected in the settings)
- Save database
- Reload - Redownload the database and rereun the query *Only available on Live Connections.
The left pane is the list of tables in the database. Red icons have no data. Blue icons have data.
The number of records is shown underneath the table name. ArtEx compares the database WITH and WITHOUT reading the WAL. If there is a difference in record count, both are shown. If Advanced SQL Recovery is in use, the number of records from the Advanced method will be shown first priot to "||".
The toolstrip allows filtering the databases or ordering between alphabetical or number of rows.
The main window is a tabbed view that shows the table data. There is a tab for WITH WAL and a tab for WITHOUT WAL.
Options in the toolstrip include:
- Convert Dates – Turns on auto-conversion of recognized DateTime fields within the database. Note that not all fields that are dates may be recognized as such.
- Show Missing Records – Any table that uses the Auto-Increment flag in SQLite databases should have consecutive numbering. Missing numbers means missing rows. This feature will insert empty rows as an indicator that there is something missing.
Tip : Right click a field header to change the view the column as a timestamp.
Right click on a cell to generate SQL to search for like value or highlight values in the table.
|
Blobs
Blobs such as BPList and Protobuf can be displayed within the SQLViewer. See the Deserializer section of this guide.
One feature here that is not mentioned elsewhere in the guid is the ability to open multiple blobs as Tabbed pages. Simply press the TAB button to open all blobs seperately, or turn it off to open the blobs one at a time.
SQL Explorer
The SQL Explorer reads the SQL Database page at a time and attempts to process the data it finds. This is effectively the same as the advanced SQL parser, but without the table association.
The window is split into 4 sections:
1 - The FILE Header is in the top left
2 - The PAGE Header is bottom left
3 - The Page (in Hex) is the top right
4 - The Page (processed as SQL) is in the bottom right
Navigate between the pages of the database using the arrow buttons at the top of the Page Header, or click the Page Number to enter a page number of offset to jump to.
Changing the selected row in the Page Header grid will change the highlighting on both the HEX and SQL panes.
Note : Jumping to an offset will process the entire page of which the offset is part. It will not take you to the exact offset you entered.
|
Note : Because each page is processed in isolation, there are no field titles used.
|
Note :
Blob data may or may not be fully processed.
Live pages should display correctly, but freepages that require overflow pages will only include the pre-overflow data. This is because the overflow may not be on the page expected.
|
WAL Explorer
The WAL Explorer reads the SQL Database frame at a time and attempts to process the data it finds. This is the same as the SQL Explorer
The window is split into 4 sections:
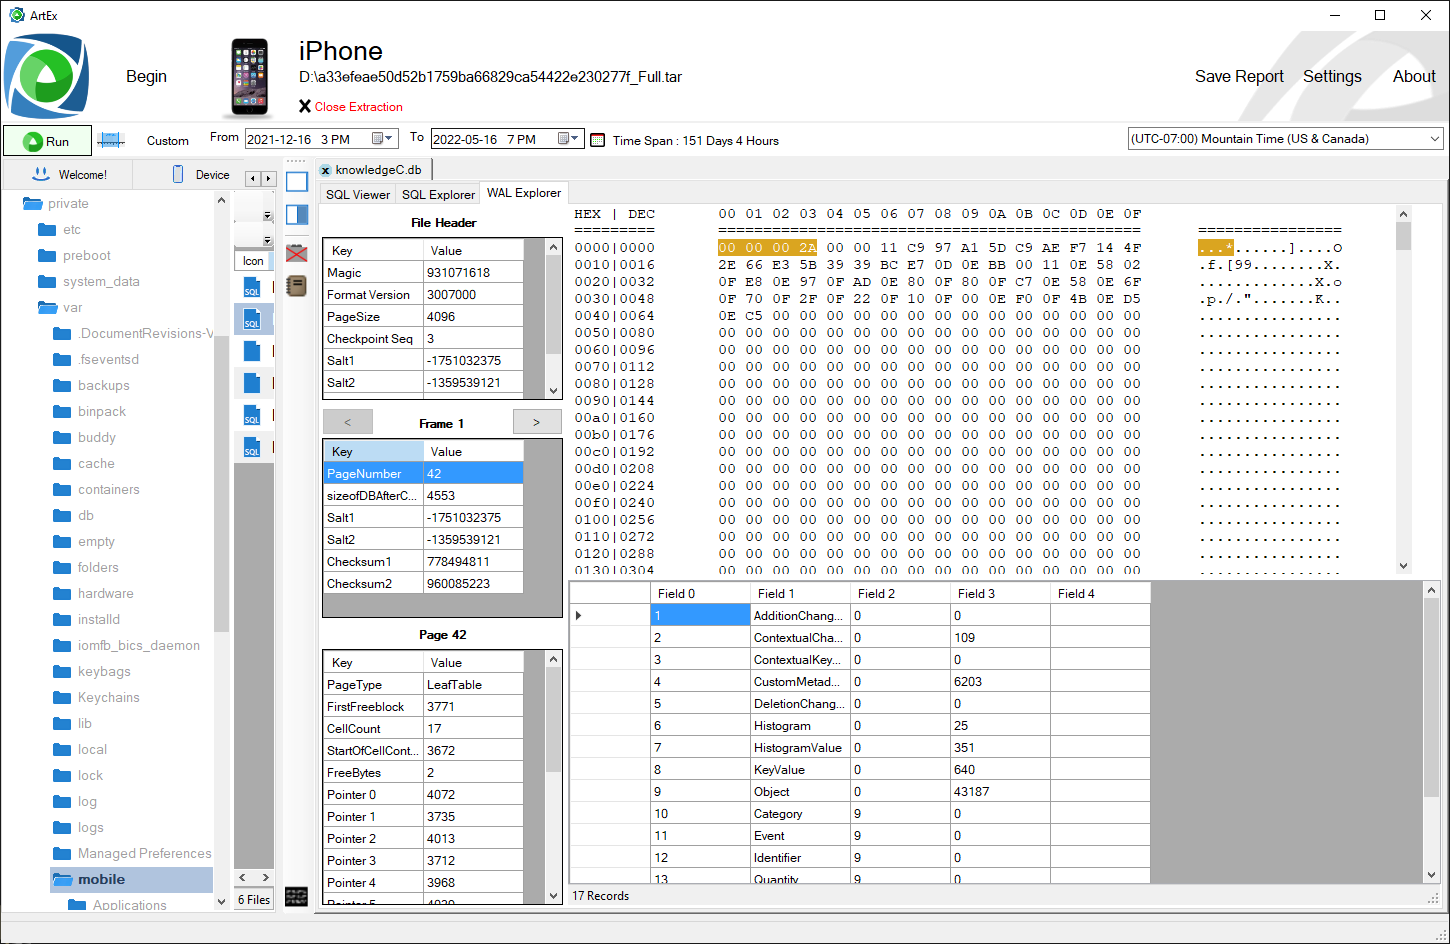
1 - The FILE Header is in the top left
2 - The FRAME Header is left center.
2 - The PAGE Header is bottom left
3 - The Page (in Hex) is the top right
4 - The Page (processed as SQL) is in the bottom right
Navigate between the pages of the database using the arrow buttons at the top of the Page Header, or click the Page Number to enter a page number of offset to jump to.
Changing the selected row in the Page Header grid will change the highlighting on both the HEX and SQL panes.
Note : Jumping to an offset will process the entire page of which the offset is part. It will not take you to the exact offset you entered.
|
Note : Because each page is processed in isolation, there are no field titles used.
|
Note :
Blob data may or may not be fully processed.
Live pages should display correctly, but freepages that require overflow pages will only include the pre-overflow data. This is because the overflow may not be on the page expected.
|
Search Type
By default, this is set to "Searching SQL", this means that anything you type in the SQL Command window will be treat as a SQL Statement. By clicking this button it will change to "Searching Table" which is a relatively unique feature.
You will notice that ArtEx tried to render blob data as text, visible in the cells. This makes it easier to see and compare the value is many rows at once. "Searching Table" allows you to search the rendered data.
For example;
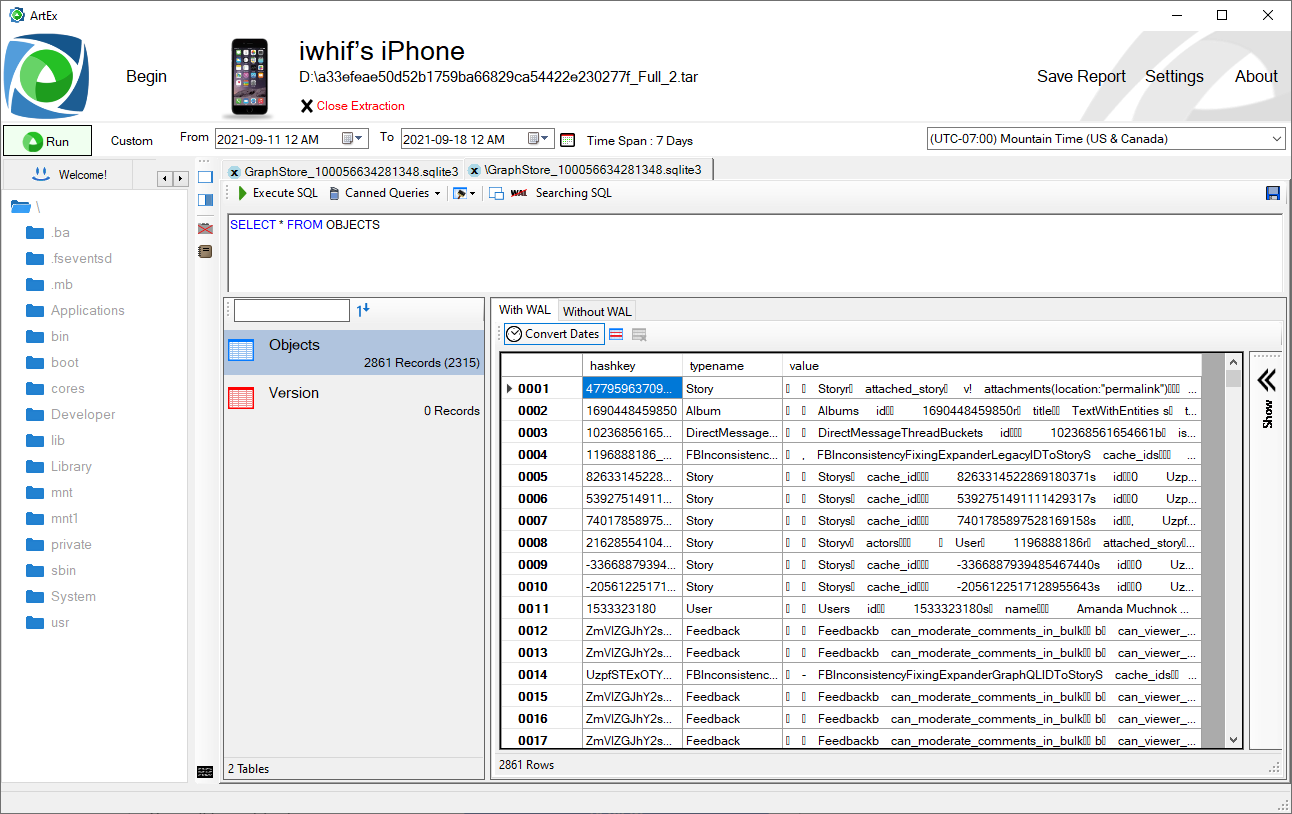
Here you can see how the VALUE field is rendered as text. |
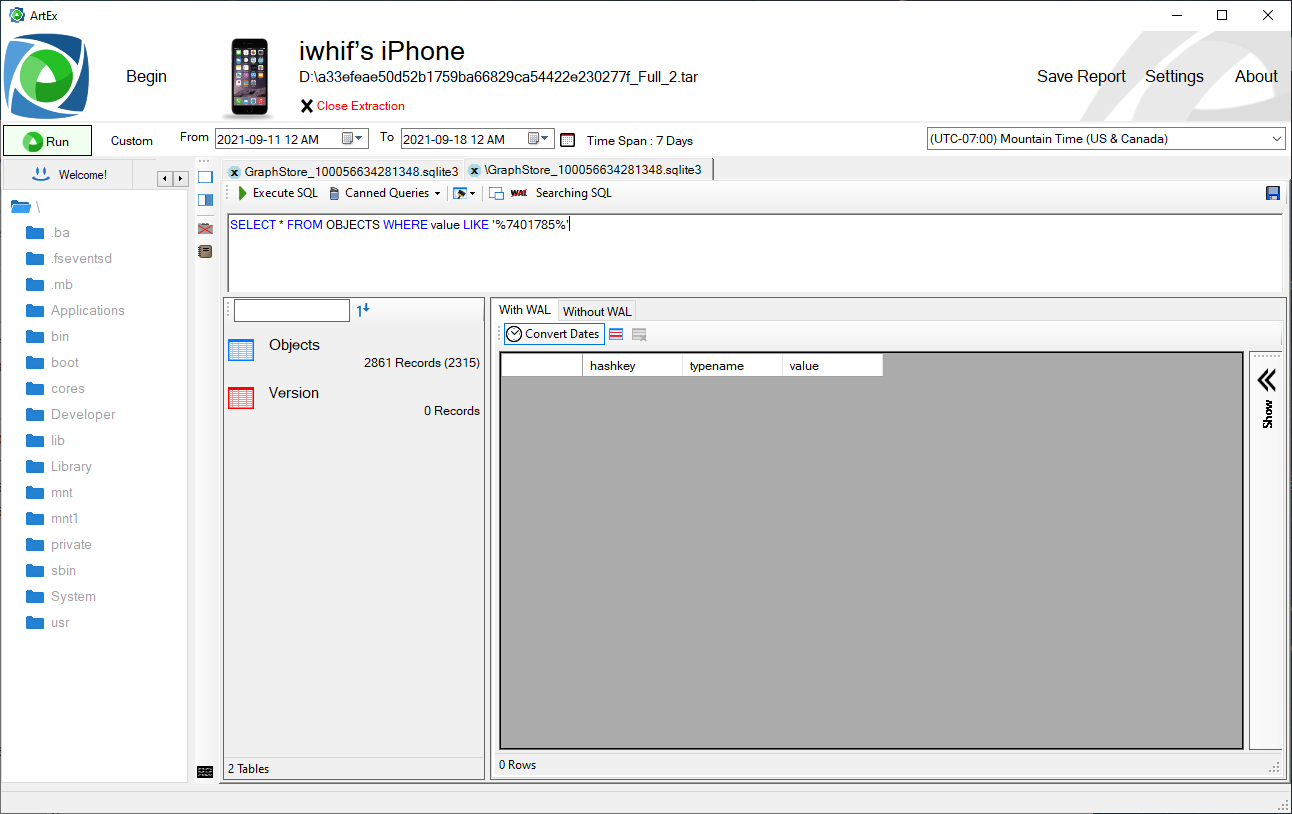
Searching within the value field yields no results.
|
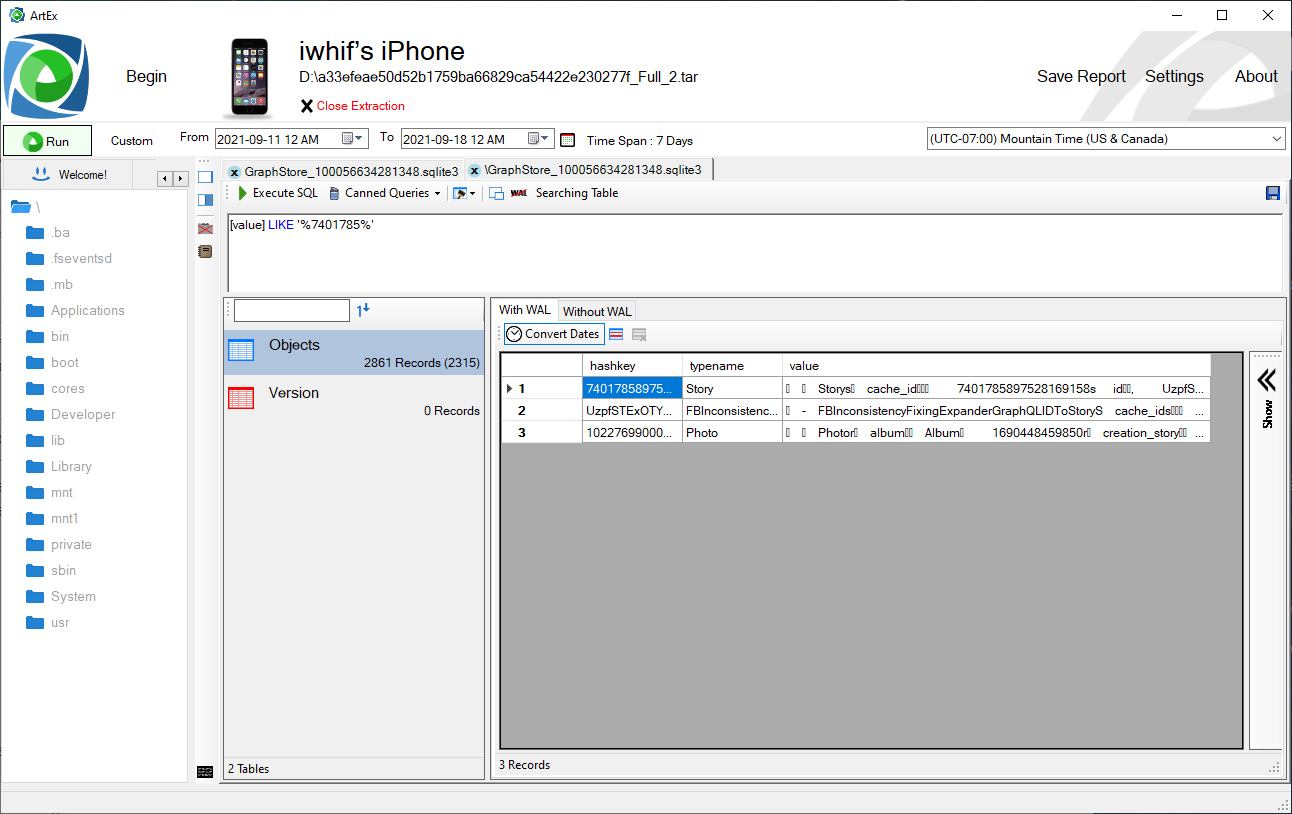
But searching within the table value field yields finds hits. |
Searching the table data works slightly differently to searching SQL. You only need to reference the column name (within square brackets) and you are limited to using wildcards at the beginning and end of the string value.
The example above is [value] LIKE '%7401785%' which works. [value] LIKE '%7401%785' would not. |
|
| |
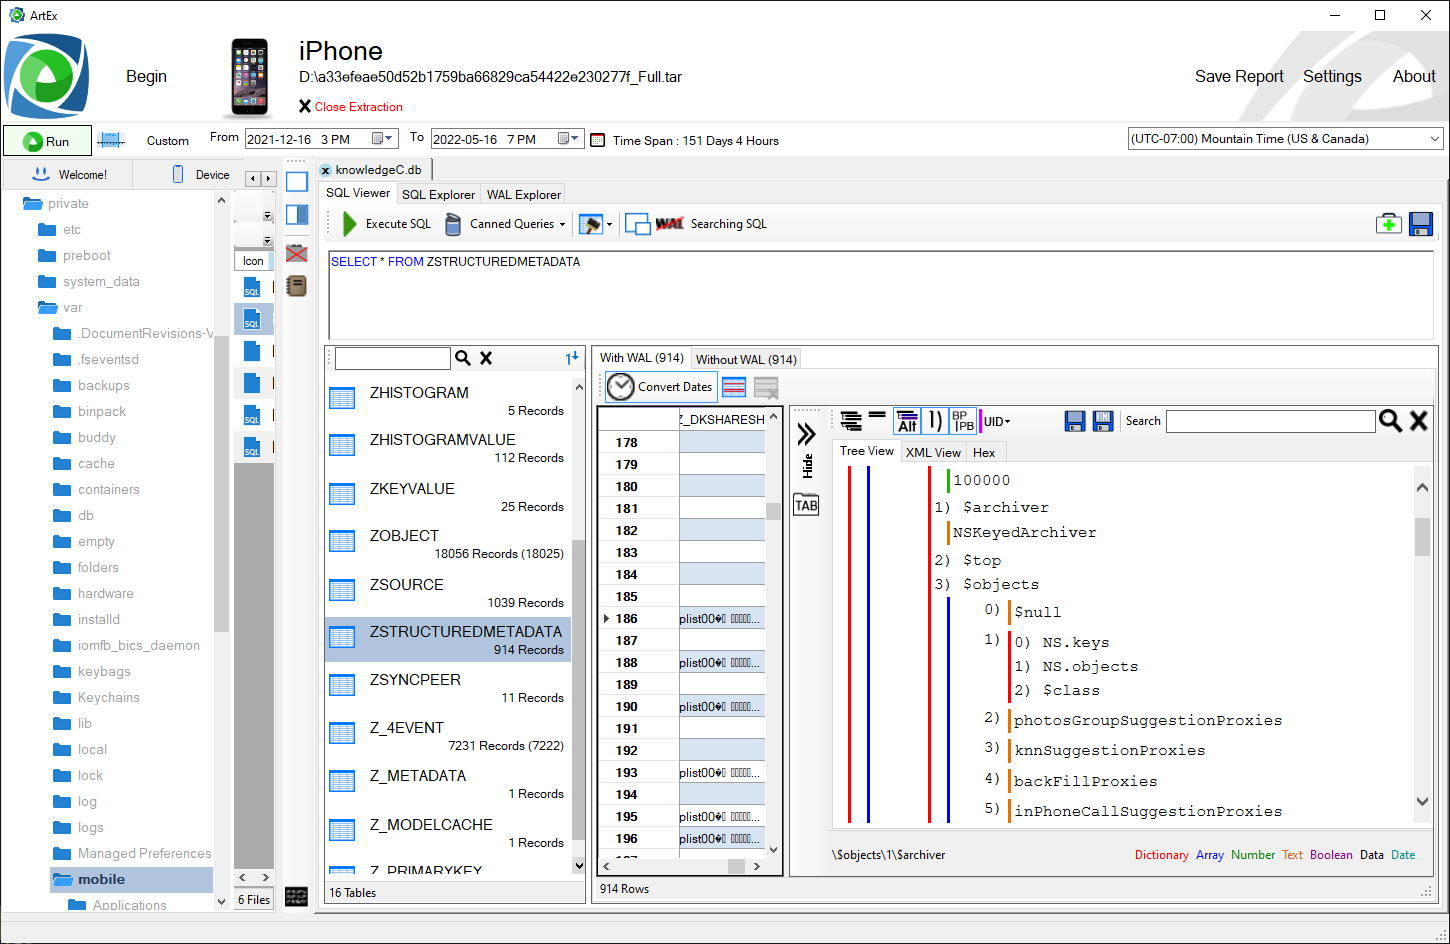
Plist/Protobuf data within a database can be viewed using the tables own Side Panel.
Alternately, these files can be viewed directly from the directory view.
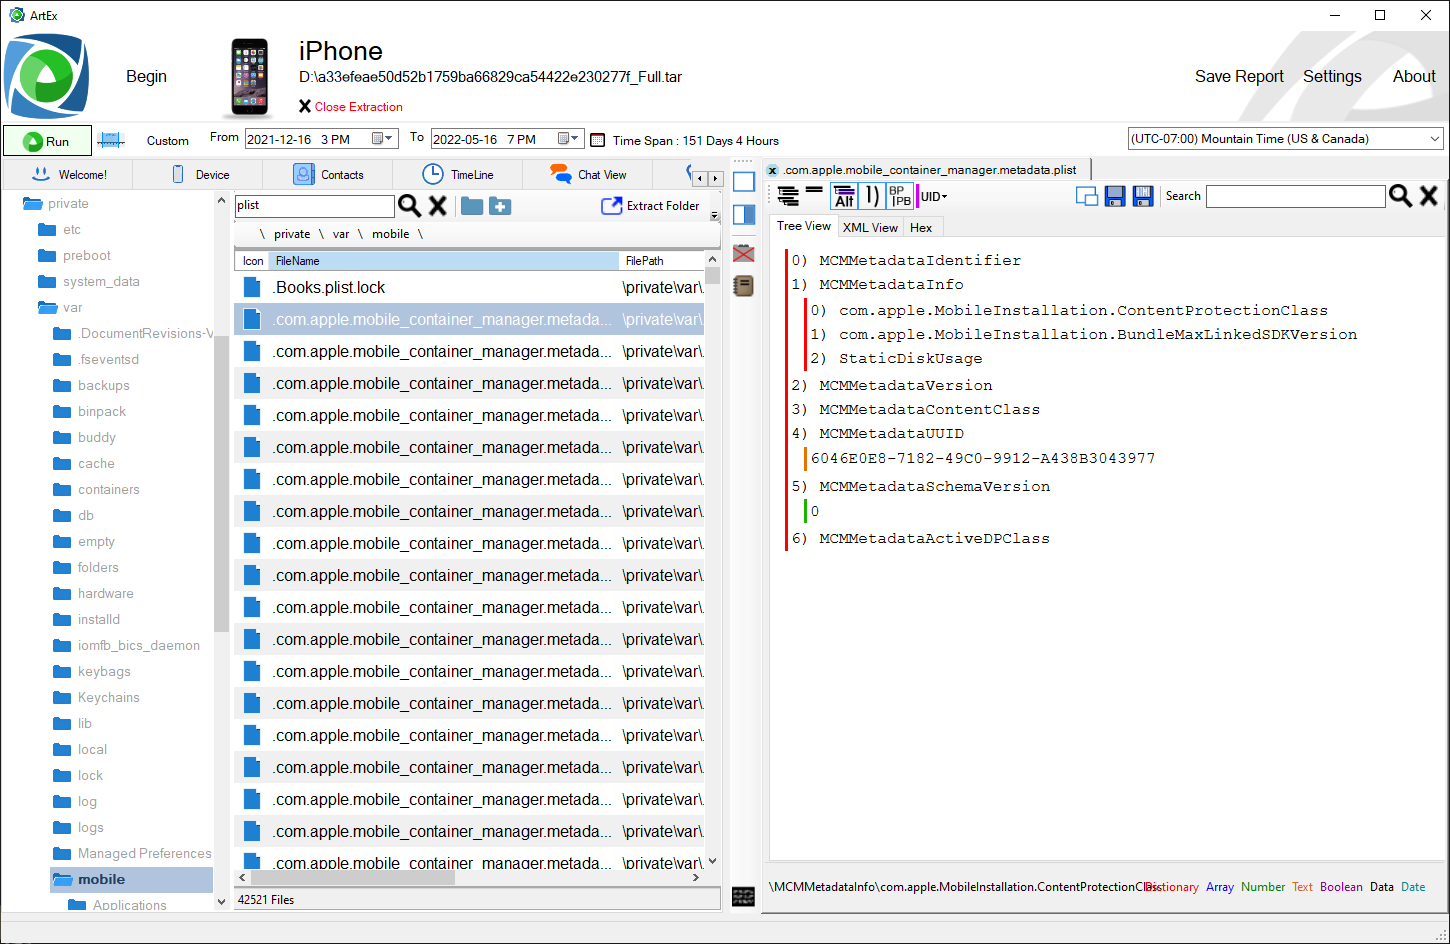
The Toolstrip includes:
- Expand / Collapse all nodes
- Export file
- Show Alternates - Relevent to Protobuf. Sometimes, the correct interpretation of Protobuf data is not obvious. A string may be mistaken for another child object for example. This option allows viewing all all alternative interpretations.
- Add Numbers – This simply adds a number to the node for easier viewing, especially when dealing with UIDs.
- PB in BP - Parse Protobuf data found inside BPLists.
- UID Drop down - Defines how ArtEx will display linked UID Data
- Float UID Data - Hover over a UID value to see the resulting information
- Embed UID Data - Embed the resulting information on the UID Reference.
- Undock – View the file in it’s own window.
At the right side there is a Search tool.
The data is presented in Tree View, XML View and Hex. |
| |
If ArtEx is unable to show the file in a defined format (such as SQLite or PList) it will resort to showing the file in Hex.
<<Image>>
The Hex Viewer has a built in data interpretor to convert the selected bytes into various data types.
| Tip : You can force Hex View from the Directory View by right clicking and selecting "View as Hex". |
| Tip : While viewing a file in Hex, press the "View As" button to load the file as a defined format (such as database or plist etc) |
|
| |
Timed Extraction allows you to create a list of files you want to repeatedly extract from a live device.
For example, while testing location data, you can select multiple files that you want to extract every few minutes.

Here, you can see that the Cache.sqlite and Cloud-V2.sqlite databases (and WALs) are selected to extract every 2 minutes. This is helpful if I want to place the laptop in my car and drive around without having to interact with it, but still pull data for comparison later.
The buttons are the bottom of the window are:
- Start
- Stop
- Extract Now
- Remove selected entry from list
- Add currently selected file from Directory View
|
| |
Report Elements are additional graphs/maps that you want to include in the report but aren’t the main image.
For example, you may want to draw attention to a particular period in time or to a particular location marker but not lose the overview graph/map.
Report Elements are added by pressing the “Add to Report Elements” button related to the image you want to add. They are accessible from the Side Panel by pressing the “Report Elements” button. |
| |
ArtEx has several Report Options.
1. Save Image - If all you want is the graph, you can use this option to save as a image. Alternately, you can copy paste.
2. CSV - Save the Timeview table as a CSV file.
3. HTML Report - This will create a multipage HTML report of the data selected. By default this includes Device Details, Contacts,Timeline, ChatView and Locations data but you can modify as required.
4. Report Creator - This way to create reports will automatically summarize the sections and allow you to add your own narrative to the data. |
| |
|
|